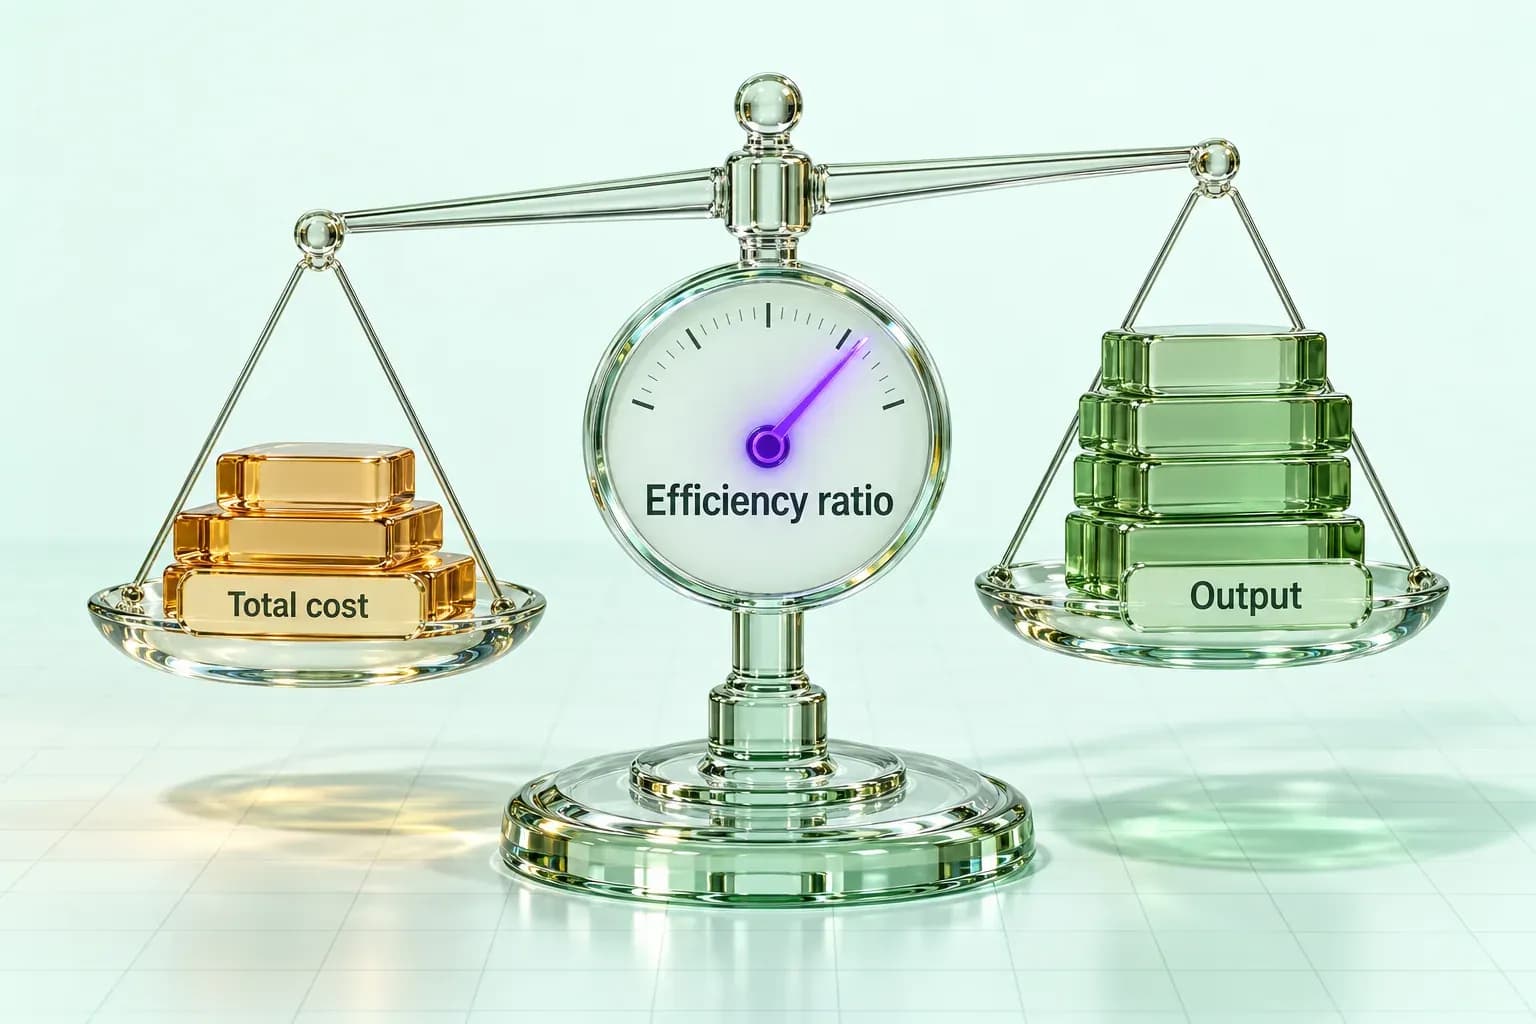
AI operational efficiency is one ratio: the value of what the system produces divided by the cost of producing it. Everything else is a proxy. The reason most AI efficiency reporting is useless is that it measures activity instead of that ratio, counting prompts run, hours notionally saved, or tickets touched, none of which tell you whether the work got cheaper or better. Fix the denominator first, then pick metrics that move it.
Start with the ratio, not the dashboard
Operational efficiency has a definition that predates AI: value of outputs divided by cost of inputs. Applying it to an AI deployment is uncomfortable because it forces both terms to be real. The numerator has to be work someone would have paid for. The denominator has to include model spend, the engineering time to build and maintain the system, and the human review that still sits between the output and the customer.
That last term is where most reporting quietly cheats. A system that drafts fifty documents an hour but needs a senior person to check each one has not reduced cost, it has moved it. Until review time is inside the denominator, the ratio is fiction.
Four AI operational efficiency metrics that hold up
Once the ratio is honest, a small set of metrics tells you whether it is improving. Each one is a different way of asking whether the work moved faster, cost less, or needed less human intervention.
- Process cycle time. How long a unit of work takes end to end, measured from request to delivered output, not from prompt to response. This is the metric that catches work which got faster in one step and slower in the handoff around it.
- Containment rate. The share of work the system completes without escalating to a person. Rising containment with flat quality is the clearest signal that efficiency is real rather than displaced.
- Cost per completed unit. Total spend divided by units actually delivered and accepted, not units generated. Generated-but-rejected output is pure denominator.
- Revenue per employee. The blunt instrument, and the one an executive will ask for. It lags the others by a quarter or more, so treat it as confirmation rather than a steering signal.
Where measurement goes wrong in practice
The most common failure is measuring the pilot instead of the process. A pilot runs on curated inputs, with the team that built it watching closely, on the subset of cases it handles well. Its numbers are real and they do not generalize. The second failure is counting time saved as money saved. An hour returned to someone who then spends it on other work is a capacity gain, not a cost reduction, and reporting it as the latter is how AI programs lose executive credibility in year two.
The third is measuring only the successes. If the system attempts a hundred tasks, completes seventy and quietly abandons thirty, a dashboard filtered to completions shows excellent efficiency for a system doing seventy percent of a job. Track attempted work, not just finished work.
What we track when we run this ourselves
Running an AI workforce for client operations, the number we watch hardest is containment against a fixed quality bar, because it is the only one that cannot be gamed by producing more. Output volume can be inflated indefinitely. Cycle time can be improved by cutting a review step that mattered. Containment measured against an unchanged acceptance standard moves only when the system genuinely got better at finishing work.
The practical setup is a command center view where approvals, deliverables and model usage sit in the same place, so the cost side and the accepted-output side are visible together rather than reconciled monthly in a spreadsheet. That pattern is described in more detail in our note on the client command center for AI operations, and the deployment shapes it applies to are covered across our enterprise AI use cases.
A starting measurement set
If you are instrumenting a deployment now, start with four numbers and resist adding more: cycle time for one named process, containment rate against a written acceptance standard, fully loaded cost per accepted unit, and rejection rate. Baseline them before the system goes live, because a baseline reconstructed afterwards is always flattering. Review monthly, and treat any metric that only ever improves as broken rather than excellent.
See what an operated AI workforce measures
Archon runs the work and reports on accepted output, not activity. See the deployment patterns and where they apply.
Explore enterprise use cases→